Utility Stocks and Interest Rates
September 2013 Client Letter
Today’s financial markets and most of society’s everyday operations are linked top to bottom by electricity. Electricity is a key component of the Internet, heating systems, medical equipment, transportation, and light. The list of items required day in and day out that rank ahead of electricity is rather short.
For years, we have favored utility companies. Investing in utility companies has a built-in layer of protection not found in most other businesses. By example, utilities are usually monopolies, and unlike almost every other business in America, when a utility makes a capital investment, it earns a guaranteed return on that investment set by local regulators (assuming proper operational execution).
Utilities’ regulated monopoly status creates a barrier to entry that prevents most forms of competition. Utility rates are set to provide enough money to run the businesses safely and efficiently, and to provide enough return to attract capital at competitive rates in order to finance new investments.
Additionally, if the cost of delivering electricity rises because of inflation, utilities pass on higher costs by applying for a rate increase. These layers of protection can make utilities a more stable investment than companies competing in markets with easy entry, low start-up costs, and super-thin profit margins, including technology and retail.
For the conservative investor, utilities offer attractive benefits, including the potential for income and capital appreciation, lower volatility than the broad equity market, and protection against inflation.
After beginning the year with a stunning 19% rally, the S&P 500 Utilities index has fallen out of favor. As explained in last month’s letter, investors seeking yield, bid up the shares of some of our favored utilities to aggressive valuations. We reduced exposure to utilities stocks as a result. But since the spring, the selling in utilities has become relentless. The S&P 500 Utilities index has fallen over 10% while the broader market has gained more than 6%—a 16% difference.
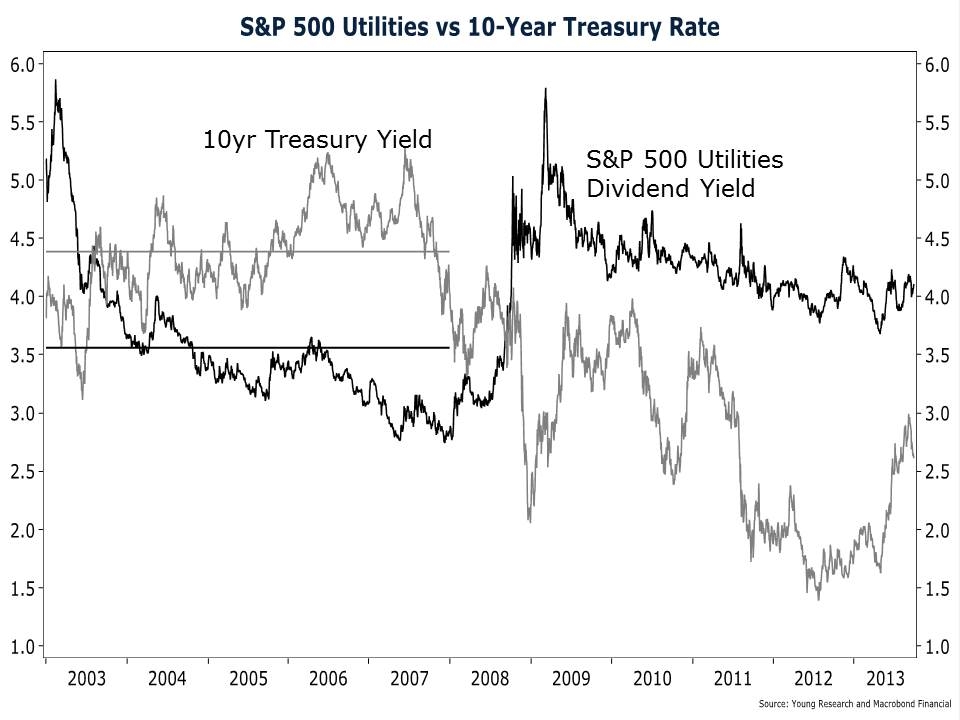
The catalyst for the sell-off in utilities was rising long-term interest rates. When interest rates rise, investors tend to sell utilities stocks first and ask questions later. But in our view, the selling has become overdone. To provide some perspective, the chart below compares the S&P 500 Utilities dividend yield to the 10-year Treasury yield. The horizontal lines in the chart show the average S&P 500 Utilities yield and the 10-year Treasury yield during the 2003–2007 economic expansion. During the prior economic expansion, investors regularly bought utilities at dividend yields that were a full 1.20 percentage points less than the yield on Treasuries. But today, with Treasury yields at less than 3%, investors don’t want anything to do with utilities stocks even though they yield more than 4%. That’s just as well in our book. We will gladly take utilities stocks with 4–5% yields off the hands of investors who would rather press their luck in more speculative sectors of the stock market.
But just because the selling in utilities stocks looks overdone doesn’t mean they can’t fall further. As most investors who have been around during the last 15 years can surely attest, the combination of bullish sentiment and misguided monetary activism can drive prices and fundamentals further apart than most expect. Nevertheless, with dividend yields of 4%–5% on many of our favored utilities, and historical dividend growth of 3%, it is reasonable to anticipate returns of 7%–8% over a full stock-market cycle.
The rise in interest rates that brought about more favorable valuations in the utilities sector has also taken the wind out of the sails of the bond market. Our fixed-income strategy keeps maturities short, and we reinvest maturing bonds into higher-yielding bonds when interest rates inevitably rise. Late last year and again in April, we even boosted our cash allocation in many portfolios—first to 7.5% and then to 10%. The higher cash allocation was an extension of our short-maturity bond strategy; minimize interest-rate risk and position portfolios to earn higher yields once rates rise.
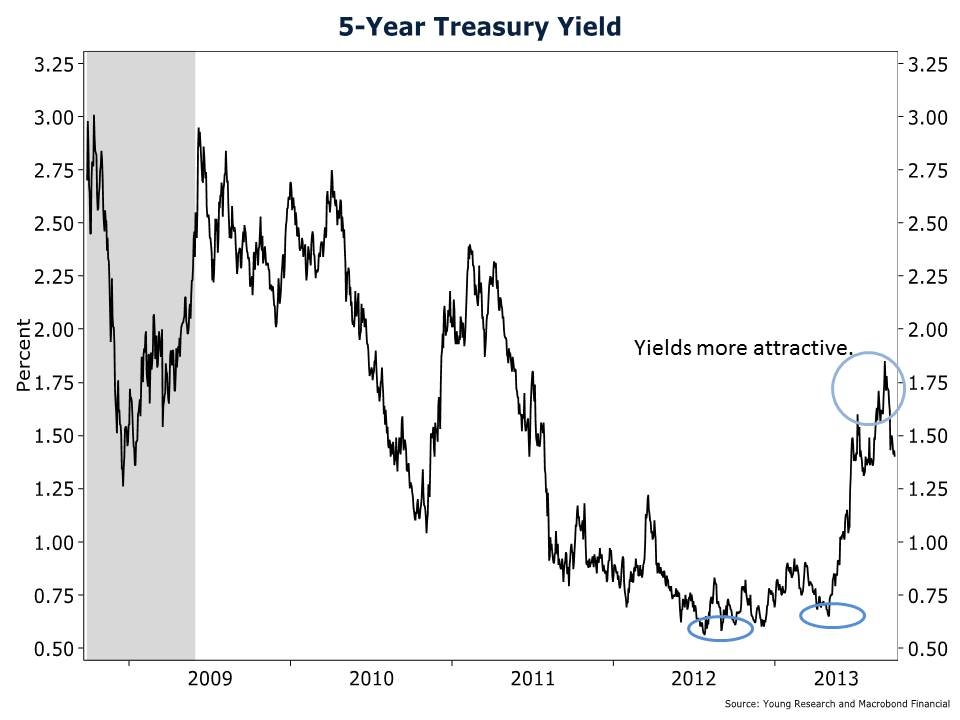
As interest rates have risen over recent months, we have been able to deploy cash and reinvest maturing bonds into higher-yielding fixed-income securities. As you can see in the chart below, the yield on five-year Treasury securities is at levels we haven’t seen in over two years. For many clients, we were able to purchase a recent bond from Southern Company—one of the largest utilities in the United States. The Southern Company bond had a five-year maturity and was rated Baa1/A- by Moody’s and S&P. We purchased the bond at a yield to maturity of nearly 2.50%. We also purchased similar-maturity bonds from Home Depot and Unilever in select corporate bond portfolios at comparable yields.
GNMA securities, like utilities, have been hurt by rising interest rates. The Vanguard GNMA fund, a large position of ours, is down a couple of percentage points on the year. GNMA securities are more interest-rate sensitive than the short-term corporate bonds also included in our fixed-income portfolios. But in return for that greater interest-rate risk, GNMA has provided an above-average yield during an agonizingly long period of ultralow interest rates. If we hadn’t owned GNMA over the last few years, our fixed-income portfolios would have earned lower yields. After a sharp sell-off that has driven GNMA yields back above 3%, the case for GNMA is as strong today as it was in 2007—on the precipice of the financial crisis.
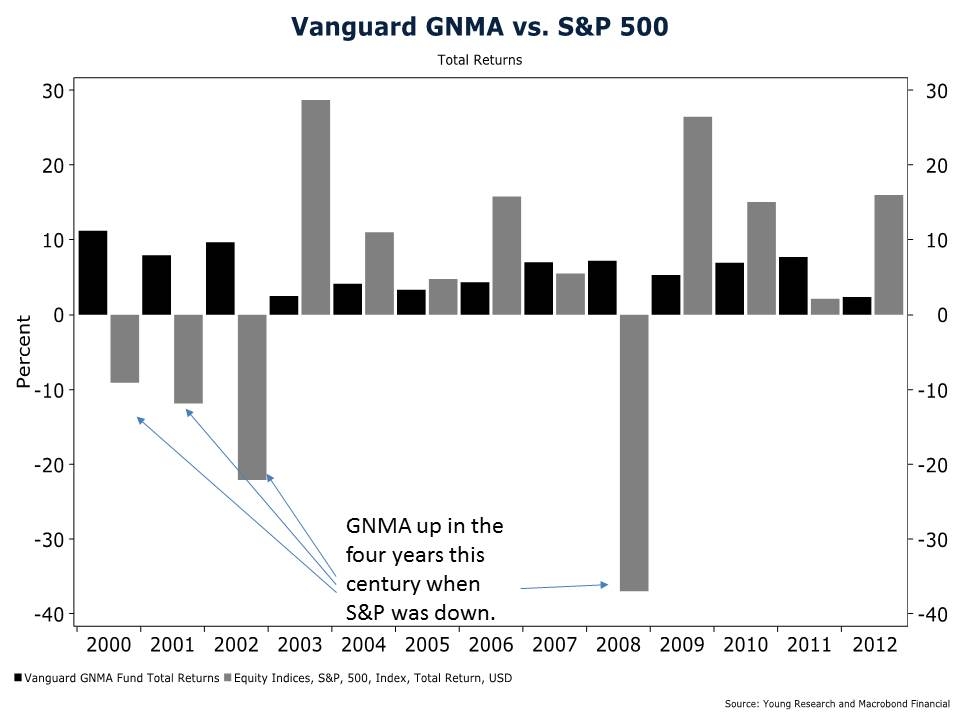
During the previous real-estate bubble, many investors abandoned GNMAs as the stock market was pushed skyward by a fed funds rate that was well below where it should have been. Sound familiar? Then in 2008, stocks were slaughtered. But 2008 wasn’t a bloodbath for everyone. The average GNMA fund tracked by Morningstar was up 6.6%. A terrific year for government mortgage-backed securities.
Take a look at the chart below. You’ll see the annual total return performances of Vanguard GNMA and the S&P 500. Right out of the gate, the S&P has an advantage in this example because the index has no expense ratio. But take a look at the consistency of GNMA. In each of the four down years for the S&P 500 this century, GNMA has been up. Right through the bursting of both the dot-com bubble and the housing bubble, GNMA rewarded investors.
It’s easy to forget the tough times when the stock market is soaring. But you’ll be glad you held your GNMA position the next time the stock market takes a tumble.
A central theme of our investment strategy is durability. Our goal is to invest in securities that have a strong likelihood of remaining in business. While we certainly could own a loser or two, we believe we reduce our odds of failure by focusing on sectors like utilities and owning a GNMA fund whose portfolio has the full-faith-and-credit pledge of the U.S. government. The focus on durability should limit unpleasant developments like the one we just saw with BlackBerry.
In the summer of 2008, BlackBerry had a market capitalization of almost $82 billion and ruled business mobile computing. You may recall candidate Obama on the campaign trail with BlackBerry close at hand. But BlackBerry faced stiff competition from the likes of Apple. On Friday, September 20, 2013, Blackberry saw its shares plunge by 17% as it announced what at least one analyst called a “disastrous” quarterly operating loss of almost $1 billion, along with plans to lay off about 40% of its staff.
Unfortunately, BlackBerry fell victim to a common occurrence within the technology sector: an established franchise or product being displaced by a newcomer. For BlackBerry, the disruption was caused by the iPhone, with its full touchscreens, cameras, and countless apps. BlackBerry, meanwhile, stayed mostly the same, with a half screen and a physical keyboard.
As is often the case in technology, once a franchise or technology is displaced by a newcomer, it can find it almost impossible to rebound. “The biggest problem (for BlackBerry) is that they won’t have money for R&D, and that’s death for a tech company,” said Neeraj Monga, an analyst at Veritas Investment Research in Toronto. “It’s not like Coca-Cola, which has been able to bottle the same formula for over 100 years.”
Have a good month, and as always, please call us at (888) 456-5444 if your financial situation has changed or if you have questions about your investment portfolio.
Sincerely,

Matthew A. Young
President and Chief Executive Officer
P.S. The market consensus for the Federal Reserve’s September meeting was an announcement that it will begin tapering its monthly bond purchases by $10 billion. Instead, the Fed went dovish, stating that QE would remain in place. Perhaps Janet Yellen has already taken over the Fed. In our view, QE3 is not boosting economic growth. What QE3 is doing is piling up the excess reserves in the banking system. There appears to be little evidence that all this money creation is contributing to economic growth. Growth is slow because the government is too big. Spending, regulation, and taxes are clogging the system and preventing our economy from reaching its full potential.
P.P.S. The current Fed appears to be a short-term-oriented central bank. Reasons the Fed cited for not tapering were that fiscal policy over the next month could be scary, that the Fed wants to see more evidence of economic strength in coincident data that is often revised and is a poor predictor of future economic growth, and that it wants to see the monthly prints of measured inflation reaccelerate.
Additionally, the Fed’s focus on low core-inflation readings indicates a narrow and limited view of inflation that may further destabilize the U.S. financial system. Just because the Fed’s 0% interest-rate policy and perpetual money-printing campaign haven’t yet resulted in higher measured consumer goods inflation doesn’t mean we have low inflation. The Fed can print money and increase liquidity, but it can’t control where money goes. Prices of homes—a good that two-third of Americans buy—are up 12% over the last year. If instead of using owners’ equivalent rent—a fictional measure of home price inflation—in the Consumer Price Index, the Fed used actual home prices, it would recognize inflation is running near 4.5%.
P.P.P.S. For the second year in a row, Barron’s has recognized Richard C. Young & Co., Ltd., as one of the top independent advisors in the country. For nearly 25 years, we have operated as an independent firm, meaning we do not underwrite securities, execute trades, or custody assets. Our advice and investment decisions are free of the conflicts of interest that plague commission-based brokers and large Wall Street firms with securities to distribute.


